Setting up Node-RED on your Gateway
Prerequisites
• Initial setup for Pressac EnOcean gateway
Navigate to the Node-RED application page by clicking “– Node-RED” in the Applications sub-menu on the Pressac EnOcean gateway web-interface.
Then change Node-RED from “Disabled” to “Enabled”.
This page also shows you the status and version of Node-RED.
The gateway provides you with a default port, username and password. We recommend that you change the username and password for Node-RED
- Status – Current status of Node-RED: active, inactive or pending (starting up).
- Version – The version number of Node-RED currently running on the gateway.
- Port – The port used to serve the Node-RED editor user interface [UI] (defaults to 1880).
Once you have entered your settings for Node-RED you can open the UI using the “Launch Node-RED” button or by using your gateway’s IP along with the port you selected, eg http://192.168.51.116.
Adding a Pressac device to Node-RED
Connect to the Node-RED UI and log in using the credentials you specified in the gateway.
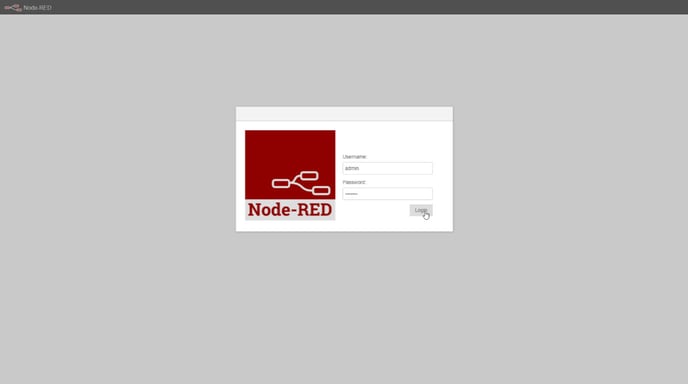
Once you have logged in you will be greeted by a blank “Flow”. This is where you will handle the data that you want to display from the gateway.
To start we will add a “Pressac sensor” and prove that you are receiving data using “Debug”.
On the left side, you will see many different nodes. The node we will be using is under the section “Input” and we will use the “Pressac sensor” node. Drag this node onto the blank flow.
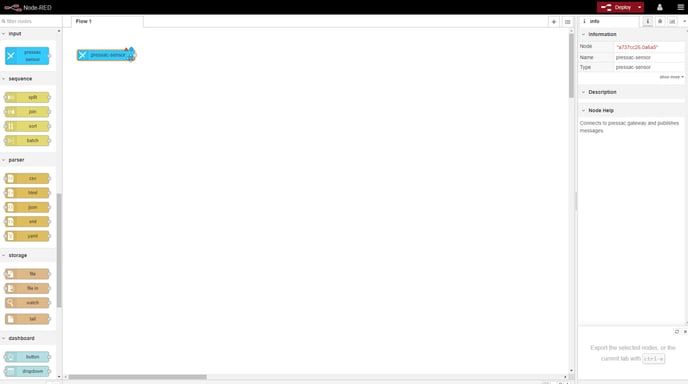
Now we will connect the node to the Pressac gateway.
To do this, double-click the node. A menu will appear on the right-hand side showing the properties of the node.
Here you can give your node a name, select your Pressac gateway and select the sensor you want to receive data from.
To select your Pressac gateway, first you will need to add it. To do this, click the pencil next to “add new remote-gateway…”.
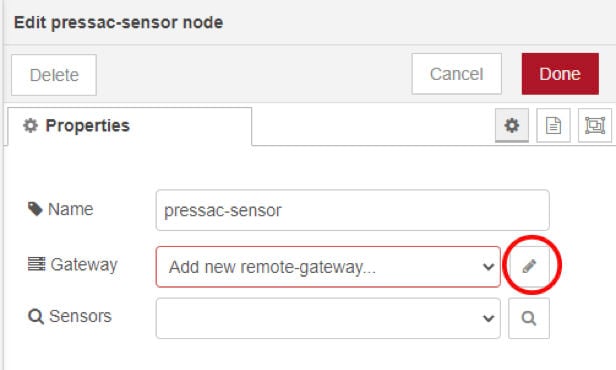
Once you have clicked the pencil, the properties page will change to a new page asking you to enter a name, IP address and password. Then click the red update button.
- Name – Name to identify the gateway.
- IP address – IP address of the gateway you are trying to connect to. You can find this on the gateway “Status” page.
- Password – Password of the gateway you are trying to connect to. This is the password you specified on the initial set up of the gateway.
Now select the gateway on the gateway drop-down menu, then select the magnifying glass on the right-hand side of “Sensors”
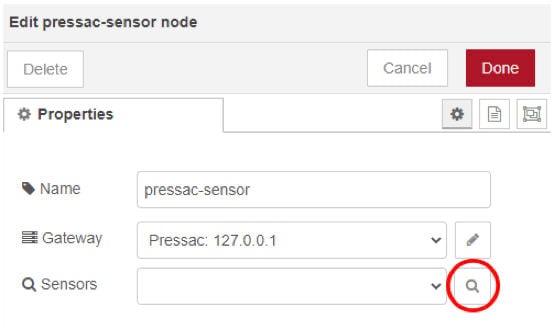
This will populate the drop-down menu with sensors that you have added to your gateway.
Select the sensor you wish to see the data from.
Now, to test if we are receiving data from the node, we will add a “Debug” node and connect it to the Pressac sensor node by clicking the rounded square on the edge of the sensor node and dragging it to the debug node.
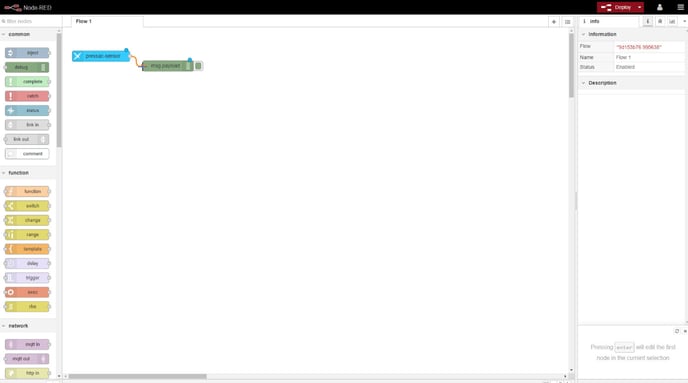
Now we have connected the two nodes we deploy the flow by clicking the red deploy button at the top of the page.
Once we have clicked this, we click the little bug icon on the top right of the screen. This will now show all the information that is going into the Debug node.
Note: If you have done this correctly you should see a payload message appear.
- Payload messages will only appear for telegrams made after deploying.
